Wednesday, 11 April 2018

Rollback Code/Config Deployment from Production


There is NO Rollback available option for Change-sets in Salesforce. But many time we come across this situation where we need immediate rollback of Change-set we deployed in Production which is not possible in Salesforce.

But yes, there are possible ways where we can stop running the changes or roll back the changes easily.

Configuration Rollback

Configs like Validation rules, workflows, process builders etc. after deploying if you want to roll back the changes, easy way is to navigate to each newly deployed component/rule and deactivate it or delete it if it is not required which is time consuming.

What if there are thousands of them then it’s a tough work to do when you want this to be immediate.

In this case:

1.     Create a Custom Label with any name i.e. ActivateAllConfig
2.     Put the Label value as True.
3.     While checking for other required conditions in above rules, add condition check for ActivateAllConfig equals to true (AND operator).
4.     So, that it will execute only if the Label value is True.
5.     After deployment, to rollback all config changes in one shot you just have to make the Label value as False.
6.     All deployed rules will stop working.


Later if needed, we can just go to all deployed rule/component and change/deactivate/delete it from Production.


Code Class/Trigger Rollback

There are many ways -


Using Change-set

1.     Create a Change-set of apex changes you will be doing before any changes are made.
2.     Move it to production and validate the change-set and keep it.
3.     Create a Change-set (in Sandbox) after your changes, move, validate, deploy in Production.
4.     If you want Rollback any time you just deploy the previous validated Change-set so your back to the original code.  


Using Force.com IDE

1.     Use an IDE to create a new project and download all classes from production (take code back up).
2.     Identify the apex changes – classes, triggers.
3.     Save to server.

NOTE: There are lot of classes then it will take time to save to Server using IDE.
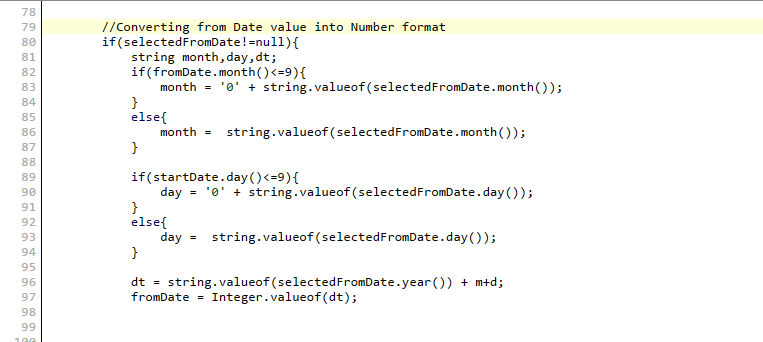

 Using Custom Label

1.     Custom label can be used the way we used for config keeping the value as True.
2.     We can add condition check in code using If condition while calling methods or before the block of code changes.
3.     So, just the Label value has to be changed to False when needed and the code will no longer execute in the org.


Using Custom Settings

If there is a situation where we want some code/class to execute and some of them to stop, there we can’t use single Custom Label for all and if we create multiple Labels, we will end up changing values for all Custom Labels used in all classes (different Labels for different classes).

In that case we can use Custom Settings with Field type Checkbox (checked/unchecked) or Text type (True/False).

1.     Create no. of Fields respective to each classes/Trigger with True/false values.
2.     Field Name can be kept as Class/Trigger name to identify the variables easily.
3.     To stop executing particular Class/Trigger, the Custom Setting field value has to be modified.
4.     Now, we can make the change to values to activate/deactivate the classes/Trigger within minutes.

There is possibility where you don’t need newly pushed class in Production anymore, there you need to delete the class using IDE, Ant etc.

Thanks!!


Saturday, 6 May 2017

Reporting Snapshot

What?
Reporting snapshot allow users to run reports and save the result as records on custom object.


How?

By scheduling the reporting snapshots at specific time, it lets you summarise data on custom object.
It means - It loads data from a custom report (Source report) to a custom object (Target object) on a scheduled basis.

It stores each row of a report as an individual record on object.

Why?

  •          It enables user to work with report data as other object records.
  •          It lets you report on historical data.
  •          Dashboard on pre-summarised data.
  •          Viewing trends in data stored in custom object.


Sounds interesting right. More than this, it’s very easy to create as well.

Let’s get started..

Let’s take a use case for better understating of its use and implementation.

Simple Use Case where we can use Reporting snapshot - To track how many Cases are opened and closed per day by user (The summarised data will be stored in one custom object to view the trends in data via the custom object).

Before setting up Reporting snapshot – we must do these following 3 steps.

1. Source report


Create a custom report on object – at which summarised data you want to load for viewing the trends via custom object.

Also, include the fields on report that you want to store as record into a target object.
NOTE: Source report must be Tabular or Summary report.


2. Target Object


Create a new custom object that will fetch source report data into it.


     3. Target Object Fields


Create fields on the Target object that will receive the results from Source report.


 After creation of source report, target object and its fields, it's time to define Reporting Snapshot.

Define Reporting Snapshot


For defining reporting snapshot :-
1.     Go to Setup, enter Reporting Snapshots in the Quick Find box.

2.     Select Reporting Snapshots.

3.     Click New Reporting Snapshot button to create reporting snapshot.


4.    Enter a name, unique name, and description for your reporting snapshot.

5.    Choose a user in the Running User field by clicking the lookup icon.           

6.   Select a report from the Source Report drop-down list.

 Important -  you can only choose either Tabular or Summary report and the drop-down    doesn’t show the Standard reports.

7.   Select a custom object from the Target Object drop-down list.

8.   Click Save to save the definition of your reporting snapshot or click Save & Edit Field    Mappings to save your reporting snapshot and map its fields with Target object.

NOTE: Based on the selected Running user’s data visibility and access, data will be loaded int the        Target object from source object.


After creating defining reporting snapshot, next step is to map the fields between source report and 
target object.

Map Fields in Reporting Snapshot


1.  Specify the Grouping Level so that, data will be extracted from the summary fields of the selected source report and will be loaded into selected target object.

2.  Grouping Level show all groupings present in Source report (up to 3 level).


3.   Now do the field mappings from source report (displayed on the left side) to target object (displayed on the right side).

4.   Click on drop-down list and select a field from the source report to map to a custom object field in the Fields in Target Object column.

5.   Only summary fields can be mapped for reporting snapshots based on summary reports. Based on grouping selected the fields may differ while mapping.


6.   Click Quick Save to save field mappings and continue mapping fields, or click Save to save field mappings and return to the reporting snapshot's detail page.


Now, we all set, only thing left is to run the report and load the data into the target object.


Schedule Reporting Snapshot


Reporting snapshot can be scheduled daily, weekly, monthly – based on your need. As we need dily Case count so we will schedule it for daily.

  1.   On reporting snapshot’s detail page, look for Schedule Reporting Snapshot section.

  2.   Click on Edit button to schedule the reporting snapshot.


  3.    Select checkbox to send email notification when it finishes running the reporting snapshot.

  4.    Schedule the reporting snapshot to run by selecting the Frequency, Start Date, End Date and Time. 

  5.    Click on Save button.


         6.   After saving the reporting snapshot, click on Edit to update the notification and frequency settings of the reporting snapshot.

        7.    Click Delete to permanently delete the existing schedule of when the reporting snapshot runs.

       Run History


After reporting snapshot finishes its run, it sends email notification based on notification settings done during its schedule. Also, we can track its history under Run History section on reporting snapshot detail page.


I hope you will like this post. So, Shoot it. Save it. Share it.

Thanks!!

Saturday, 8 October 2016

Analytics Report Chart with Dynamic Filter

Analytics:reportChart visualforce component is used to add Salesforce report chart to a Visualforce page. You can add filter to the chart data.

We have to pass report id in the reportId attribute and to filter the data, pass criteria in the filter attribute.

Before adding charts into Visulaforce page, make sure
  1.   You have created required source reports in Salesforce org.
  2.   Give required access to report folder.
  3.   Important: Add chart to the Source Report.
If you forget adding chart into the report then it will show error message on the chart - You can't view the report chart because its report, report type, or chart has been deleted.

Steps to add Analytics chart into the VF page:
  1.  Create report Opportunity Pipeline with chart added into it and save the report.
  2.  Create a Visualforce page AnalyticsReportChart.
  3.  Add <analytics:reportChart> component into the VF page.
  4.  Put unique Report Id of the source report (get id from the Report URL) in the ReportId attribute in the <analytics:reportChart reportId=””> component.
  5.  Or create a Custom Label to store the Report Id and use the $Label on page.

 6.  Save and run the page to see the Report chart on the page.


NOTE: To add report header (here Opportunity Pipeline), add the header text in the source Report chart.

The Filter Attribute

Filter a chart data by fields to show specific results. A report can have up to 20 field filters.
A filter has three attributes as below:

Column – Field API name
Operator – Condition API name (Example- Greater Than - greaterThan )
Value – The Filter Criteria. 

Example :-


NOTE: To get the API name of the Field and the Operator, make a describe request via the Analytics REST API or Analytics Apex Library.

To know more about the attributes, go through this link – analytics:reportChart
-------------------------------------------------------------------------------------------------------------------------
-------------------------------------------------------------------------------------------------------------------------
Recently, in one of our project we got requirement where we had to pass dynamic filters such as selected Users and dynamic Date Range into the chart.

Passing dynamic value in filter is not a challenging work as we can pass the selected values for particular field in the value attribute of Filter (using {!varName}).

In Date Filter, the Value attribute only accepts yyyy-MM-dd format. If you will enter any other format of Date, it will show error message on the chart.

For Example :- If 08-10-2016 entered as a value in the filter for Created Date, it will display error as shown below:

Now the challenging part – When Date range (From Date & To Date) was selected and passed to the chart filter, it was showing wrong data on it and when chart was clicked to view the source report, it redirected to the report where the filter date was changed to some other date.

For Example :– Selected Date 2016-10-01 (1st October) changed to 10/01/2016 (10th January), it should be 01/10/2016 on the report.

To figure out the problem, we tried logged in as different users. And We found that, for some user it was working perfectly and also for some other user, it was showing wrong data.

Reason – Based on Locale Settings of each user, it changes the date format on the report filter (you can see the parameters passed on the report URL).

To resolve this issue, we explored all available forums, twitter, blogs but didn’t get any post related to this.

Solution we came up with :–
  • Create a formula field Created_Date on Opportunity which return Number.
  • Enter the following formula and save it.


  • If Created date is 8/10/2016, it will return 20161008 (year+month+day) as its value.
  • Replace the field from CREATED_DATE to Opportunity. Created_Date__c in the Column attribute of filter. 


  • As the Created Date is in Number format, the Selected Date has to be passed as Number.
  • So in the controller, the selected Date was formatted as Number (year+month+day).


Whenever the Date range was selected on the page to pass on to the report filter, it was getting formatted as number (year+month+day) and was checking with the custom Created_Date field which was also containing the CreatedDate in the Number format.
Finally, it started showing correct data on Chart irrespective of the Locale setting of the logged in user and its done.

I hope you will like this post. So, Shoot it. Save it. Share it.

Thanks!!