We have to
pass report id in the reportId attribute and to filter the data, pass criteria
in the filter attribute.
Before
adding charts into Visulaforce page, make sure
- You have created required source reports in Salesforce org.
- Give required access to report folder.
- Important: Add chart to the Source Report.
If you forget
adding chart into the report then it will show error message on the chart - You can't view the report chart because its
report, report type, or chart has been deleted.
Steps to add
Analytics chart into the VF page:
- Create report Opportunity Pipeline with chart added into it and save the report.
- Create a Visualforce page AnalyticsReportChart.
- Add <analytics:reportChart> component into the VF page.
- Put unique Report Id of the source report (get id from the Report URL) in the ReportId attribute in the <analytics:reportChart reportId=””> component.
- Or create a Custom Label to store the Report Id and use the $Label on page.
 6. Save and run the page to see the Report chart on the page.
NOTE: To add
report header (here Opportunity Pipeline), add the header text in the source Report
chart.
The Filter Attribute
Filter a
chart data by fields to show specific results. A report can have up to 20 field
filters.
A filter has
three attributes as below:
Column – Field API name
Operator – Condition API name (Example- Greater Than - greaterThan )
Value – The Filter Criteria.
Example :-

NOTE: To get
the API name of the Field and the Operator, make a describe request via the
Analytics REST API or Analytics Apex Library.
To know more
about the attributes, go through this link – analytics:reportChart
-------------------------------------------------------------------------------------------------------------------------
-------------------------------------------------------------------------------------------------------------------------
Recently, in
one of our project we got requirement where we had to pass dynamic filters such
as selected Users and dynamic Date Range into the chart.
Passing
dynamic value in filter is not a challenging work as we can pass the selected
values for particular field in the value attribute of Filter (using {!varName}).
In Date Filter, the Value attribute only
accepts yyyy-MM-dd format. If you will enter any other
format of Date, it will show error message on the chart.
For Example :- If 08-10-2016 entered as a value in the filter for Created Date, it will display
error as shown below:

Now the
challenging part – When Date range (From Date & To Date) was selected and passed to the chart filter, it was
showing wrong data on it and when chart was clicked to view the source report, it redirected to the report where the filter date was changed to some other date.
For Example :–
Selected Date 2016-10-01 (1st October) changed to 10/01/2016 (10th
January), it should be 01/10/2016 on the report.
To figure
out the problem, we tried logged in as different users. And We found that, for
some user it was working perfectly and also for some other user, it
Reason – Based
on Locale Settings of each user, it changes the date format on the report filter (you can see the parameters passed on the
report URL).
To resolve
this issue, we explored all available forums, twitter, blogs but didn’t get any
post related to this.
Solution we came up with :–
- Create a formula field Created_Date on Opportunity which return Number.
- Enter the following formula and save it.

- If Created date is 8/10/2016, it will return 20161008 (year+month+day) as its value.
- Replace the field from CREATED_DATE to Opportunity. Created_Date__c in the Column attribute of filter.

- As the Created Date is in Number format, the Selected Date has to be passed as Number.
- So in the controller, the selected Date was formatted as Number (year+month+day).
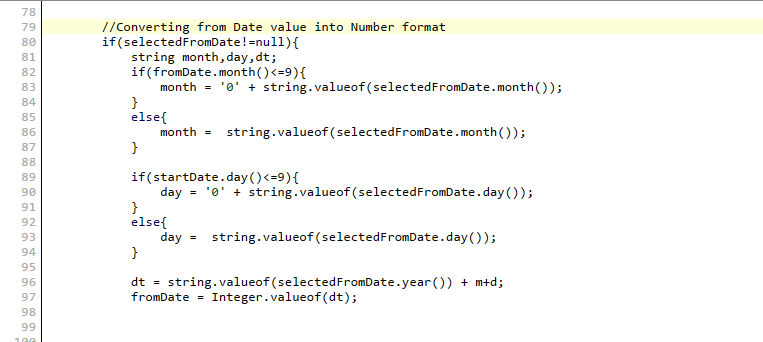
Whenever the Date range was selected on the page to pass on to the report filter, it was getting formatted as number (year+month+day) and was checking with the custom Created_Date field which was also containing the CreatedDate in the Number format.
Finally, it started showing correct data on Chart irrespective of the Locale setting of the logged in user and its done.
I hope you will like this post. So, Shoot it. Save it. Share it.
Thanks!!